
Market analysis is the backbone of every trading decision. For beginners, the sheer volume of information, indicators, chart patterns, and economic data can feel overwhelming. The good news is that you don't need to master everything at once. In fact, the most successful traders are usually the ones who keep their analysis simple and repeatable. This guide will walk you through the essential market analysis techniques that every beginner should know, from basic chart reading to understanding the economic forces that move prices. Whether you're trading forex, stocks, or commodities, these foundational skills will give you the confidence to make informed decisions and build a trading strategy that actually works.
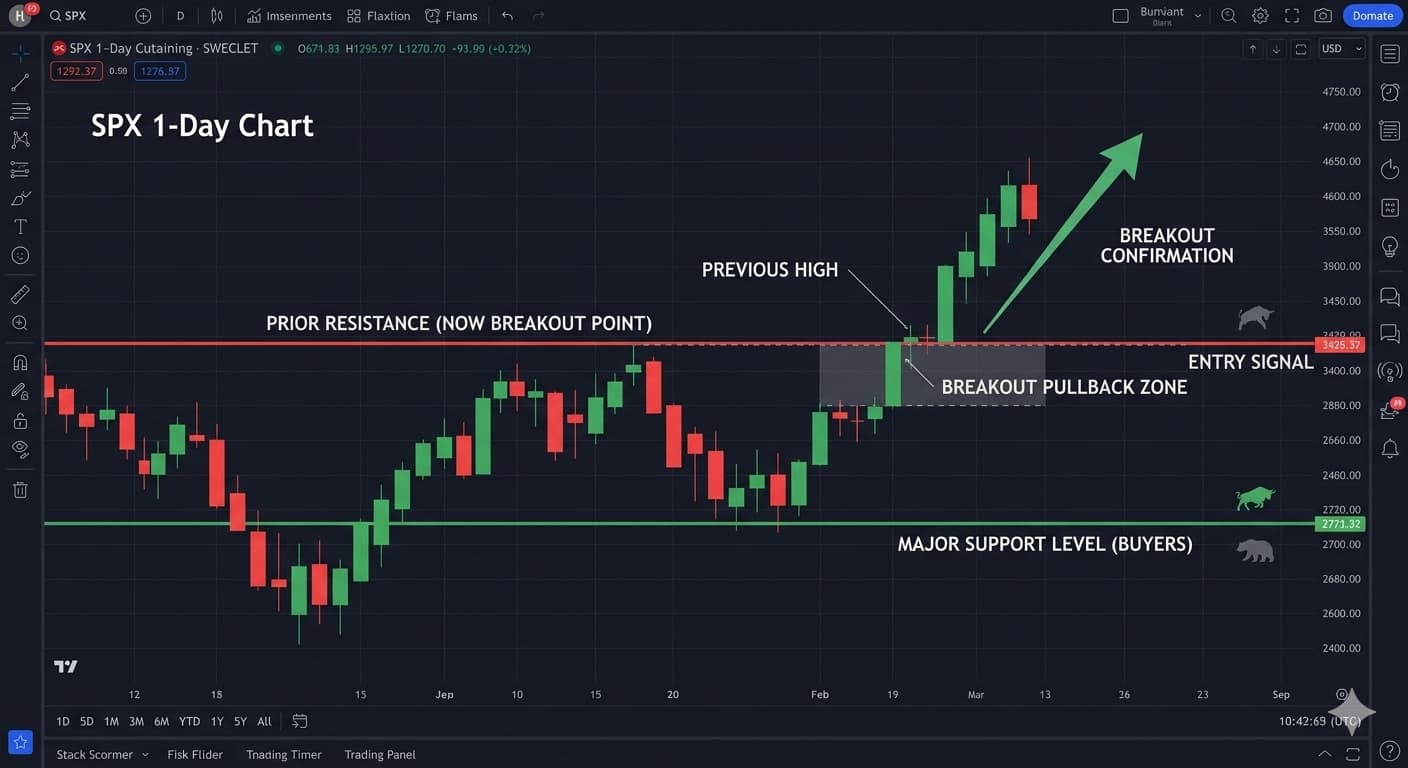
Technical analysis is the study of price action and market statistics. It's based on the idea that price movement is not random and that historical patterns tend to repeat themselves. For beginners, the most important technical concepts to understand are support and resistance levels. Support is a price level where buying pressure is strong enough to overcome selling pressure, causing the price to bounce upward. Resistance is the opposite — a level where selling pressure outweighs buying, pushing the price down. These levels form because traders remember where the price has reversed before, and they place buy or sell orders at those same levels. Drawing support and resistance lines on your chart is one of the simplest yet most powerful analysis techniques you can learn. Start by looking for areas where the price has reversed at least twice — the more times a level has been tested, the more significant it becomes.
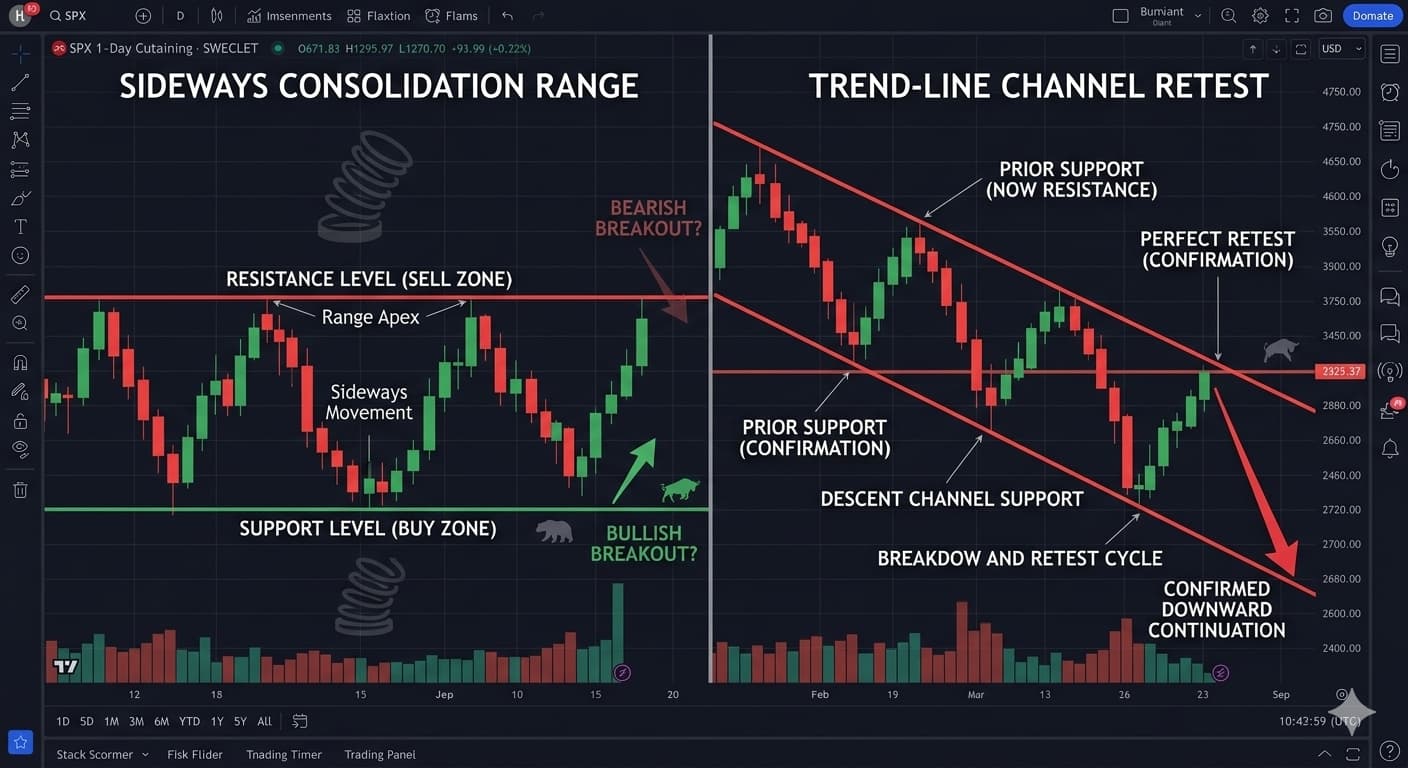
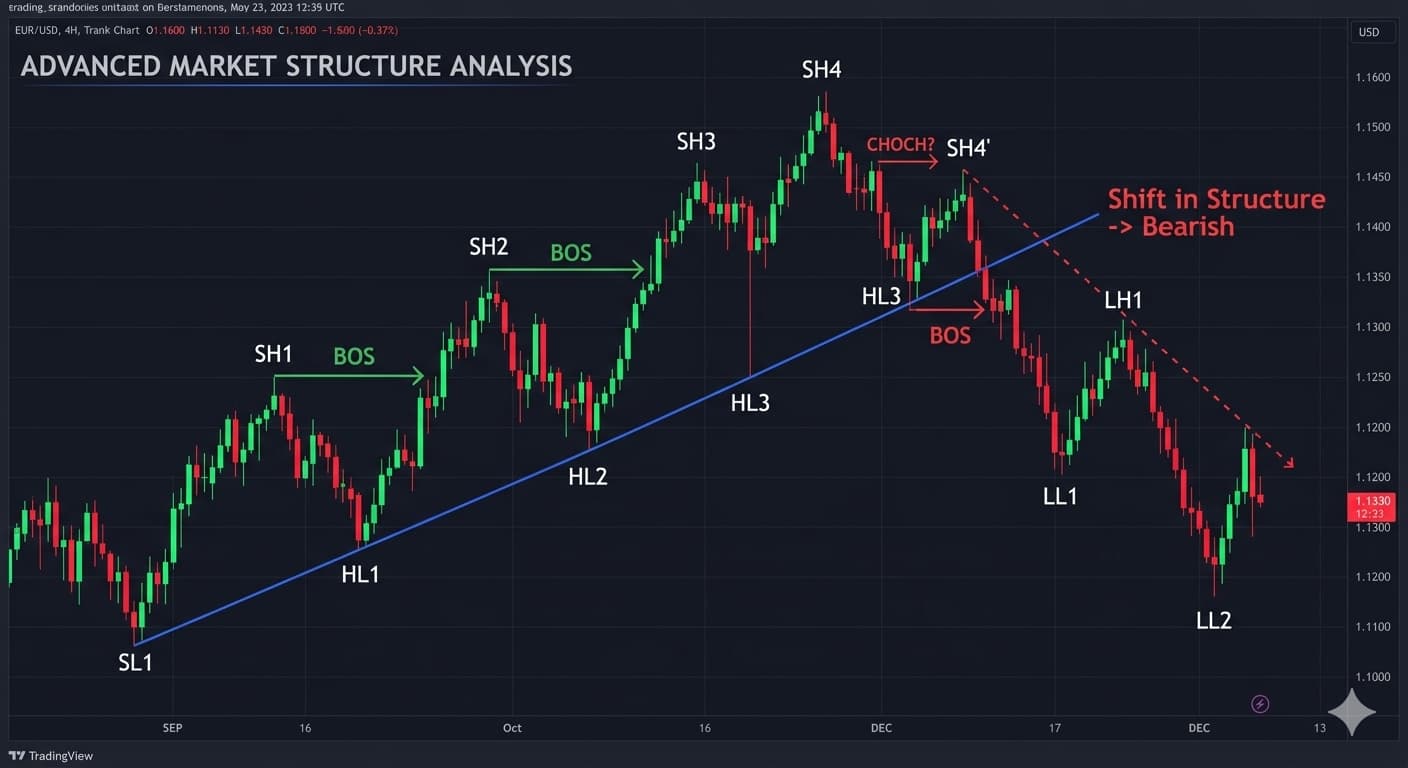
Trend lines are another fundamental tool in technical analysis. Markets move in trends — uptrends, downtrends, and sideways ranges. An uptrend is characterized by higher highs and higher lows. A downtrend shows lower highs and lower lows. A sideways trend, or consolidation, occurs when the price moves within a defined range without a clear direction. Drawing a trend line by connecting two or more swing lows in an uptrend, or two or more swing highs in a downtrend, gives you a visual representation of the trend's path. More importantly, trend lines help you identify when the trend might be changing. A break below an uptrend line could signal that the bullish momentum is weakening, while a break above a downtrend line might suggest a potential reversal. The key principle to remember is this: trade in the direction of the trend. It's much easier to make money when the market is already moving in your favor than when you're trying to fight the trend.
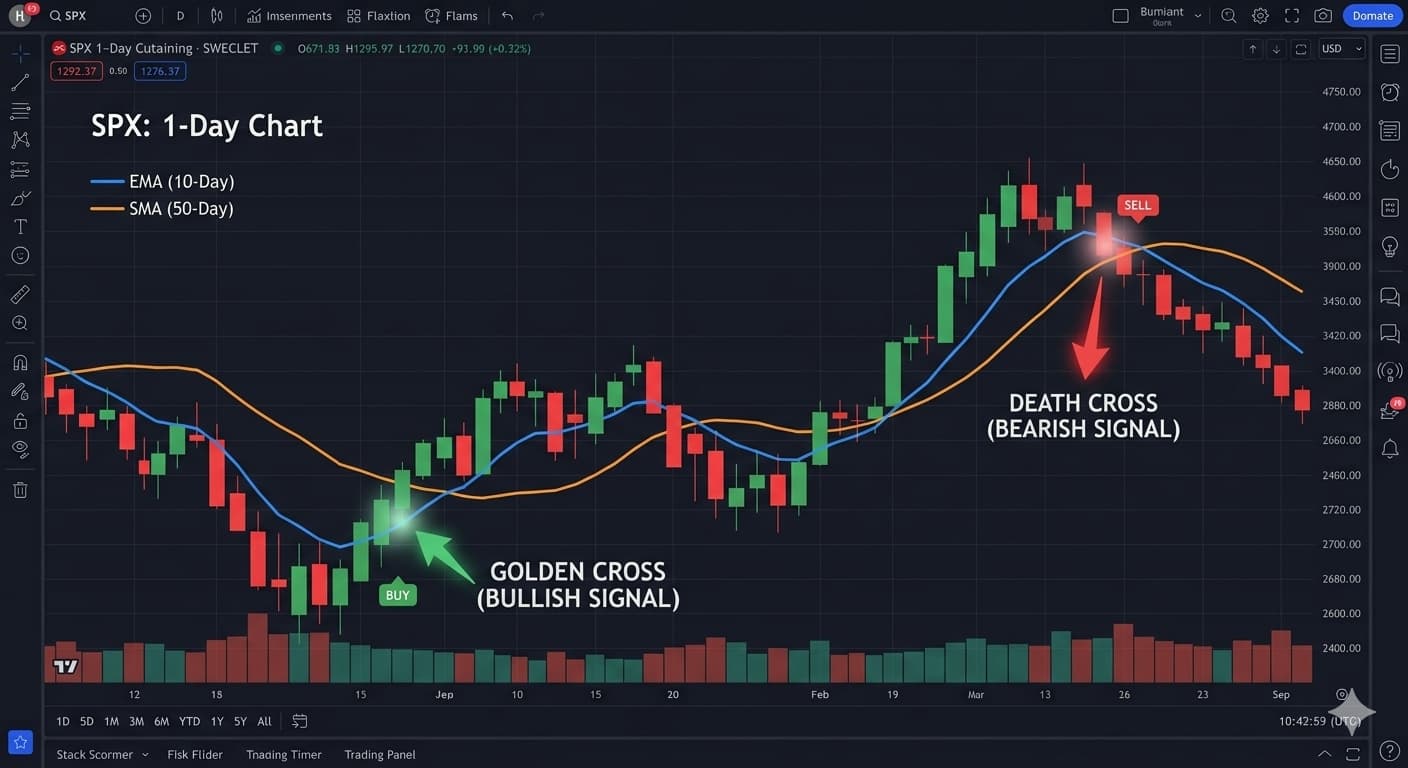
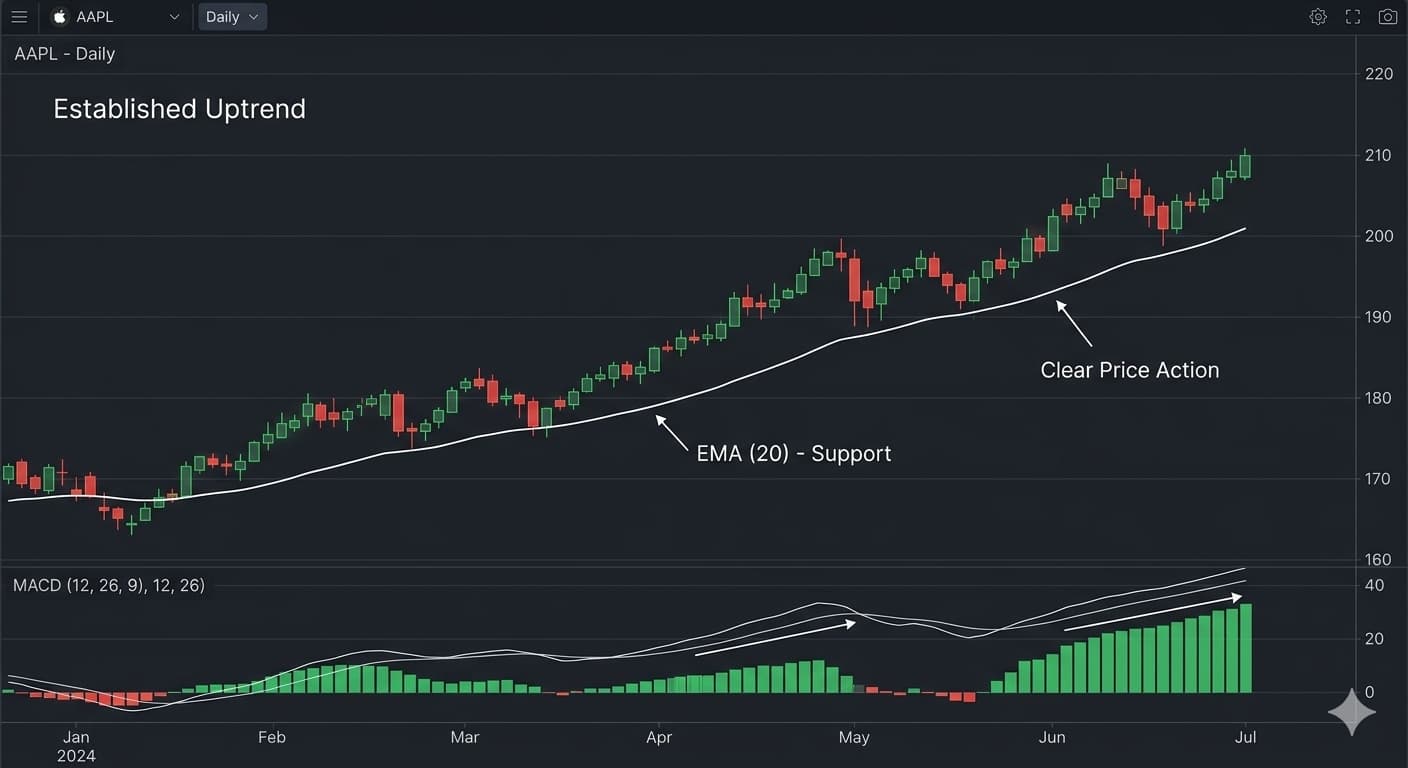
Moving averages are one of the most popular technical indicators because they smooth out price data and help traders identify the underlying trend. A moving average calculates the average price of an asset over a specific period, updating continuously as new data comes in. The two most common types are the simple moving average, or SMA, which gives equal weight to all prices in the period, and the exponential moving average, or EMA, which gives more weight to recent prices. For beginners, start with two moving averages: a short-term MA, such as the 20-period EMA, and a longer-term MA, such as the 50-period SMA or 200-period SMA. When the shorter MA crosses above the longer MA, it's called a golden cross and suggests bullish momentum. When the shorter MA crosses below the longer MA, it's called a death cross and suggests bearish momentum. Moving averages also act as dynamic support and resistance levels. In an uptrend, the price often pulls back to the 20-period EMA before continuing higher. Understanding how moving averages work gives you a powerful tool for confirming trends and identifying potential entry points.
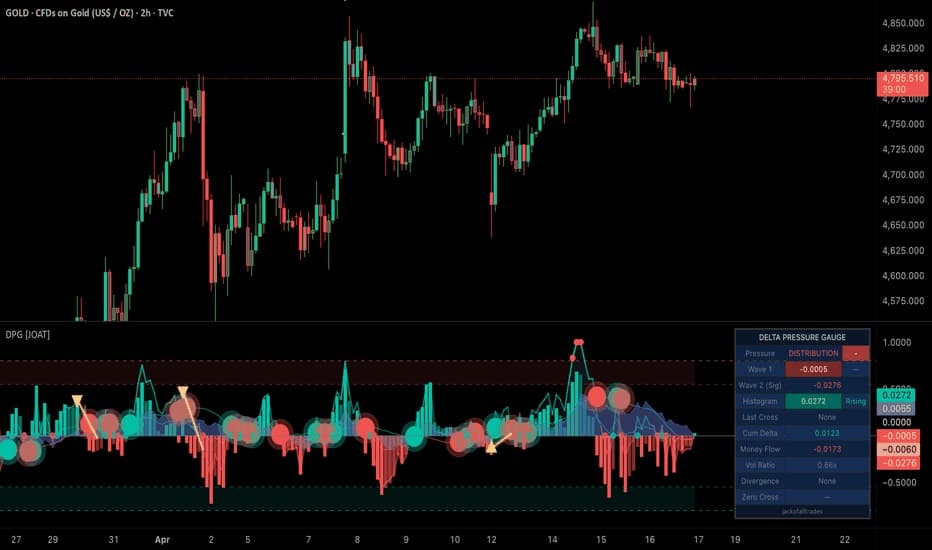
Volume analysis is often overlooked by beginners, but it provides crucial context for price movements. Volume measures the number of shares, contracts, or units traded during a given period. High volume during a price move confirms that the move is supported by strong trader participation. Low volume during a breakout, for example, suggests that the breakout might be weak and likely to fail. Volume can also help identify reversals. When the price is rising but volume is declining, it's a warning sign that the upward momentum is running out of steam. Conversely, when the price is falling on high volume, it indicates strong selling pressure. One of the most useful volume patterns is the volume spike — a sudden, sharp increase in trading volume that often coincides with significant news or institutional activity. Learning to read volume alongside price action will dramatically improve the quality of your analysis. At FFT, we emphasize that successful traders look for confluence — multiple signals that point in the same direction. Volume confirmation is one of the best forms of confluence available.
Candlestick patterns are visual representations of price action within a specific timeframe. Each candlestick shows the opening price, closing price, highest price, and lowest price for that period. By learning to read candlestick patterns, you can quickly assess market sentiment and potential reversals. For beginners, start with the most reliable patterns. The hammer and the inverted hammer are bullish reversal patterns that appear after a downtrend, suggesting that selling pressure is weakening. The shooting star and the hanging man are bearish reversal patterns that appear after an uptrend. The engulfing patterns — bullish engulfing and bearish engulfing — are strong reversal signals where one candle completely 'engulfs' the body of the previous candle. The doji represents indecision in the market and often appears before a significant move. The key to using candlestick patterns effectively is context. A hammer pattern is far more reliable when it appears at a clear support level after a downtrend than when it appears in the middle of a choppy, sideways market. Always look for patterns in the context of support, resistance, and trend direction.
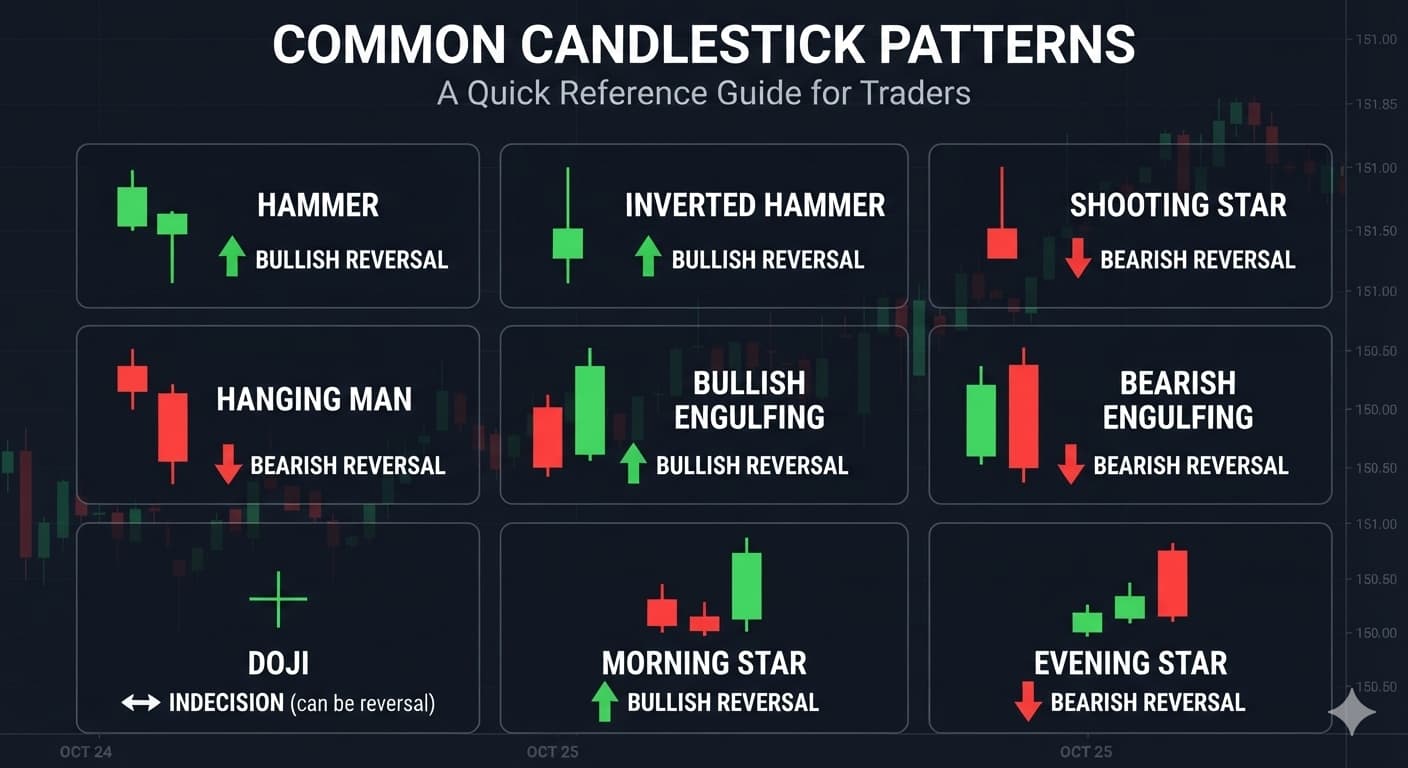
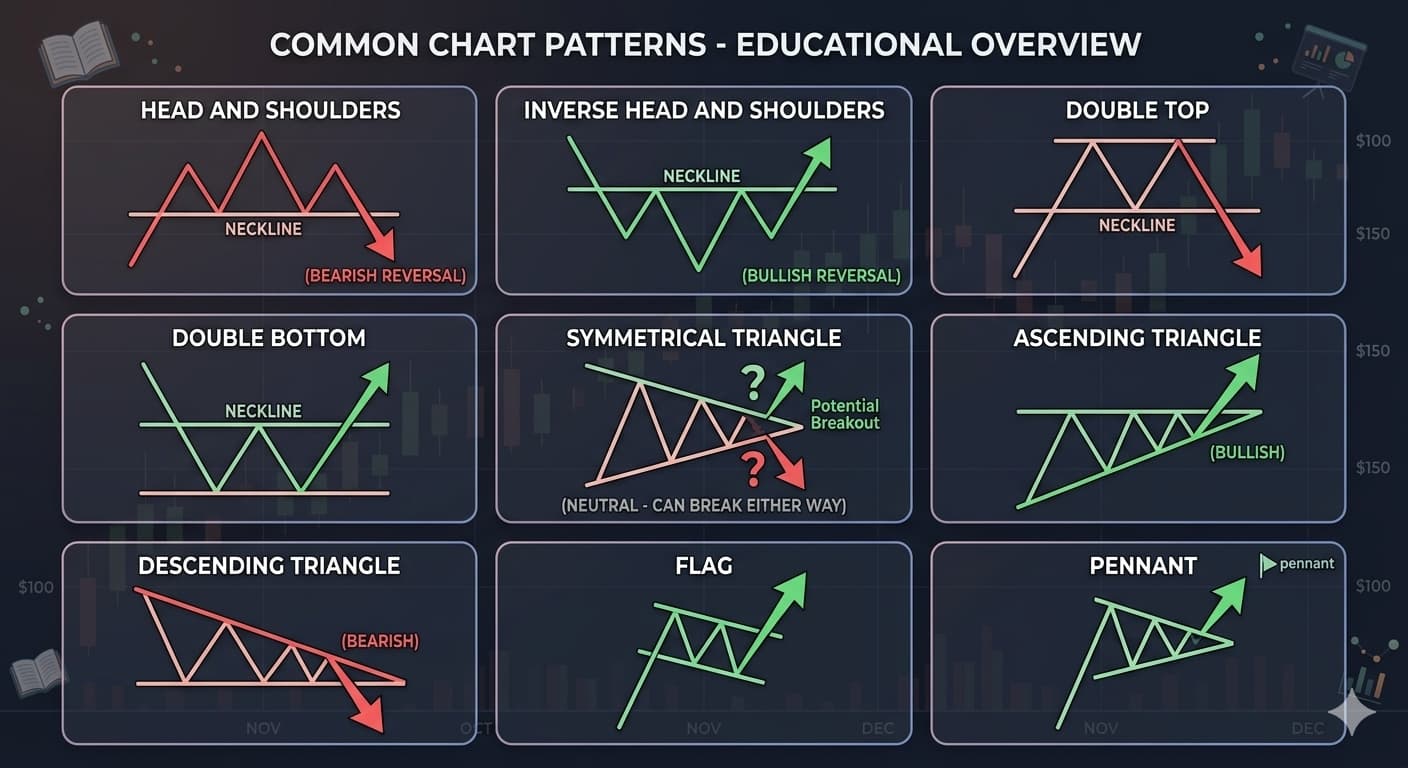
Chart patterns are larger formations that develop over multiple candlesticks and signal potential future price movements. The head and shoulders pattern is one of the most reliable reversal patterns, consisting of three peaks with the middle peak, or head, being the highest. A break below the neckline confirms the pattern and suggests a downward move. The inverse head and shoulders is the opposite — a bullish reversal pattern with three valleys. The double top and double bottom patterns are simpler but equally powerful. A double top forms when the price hits the same resistance level twice and then drops, while a double bottom forms when the price hits the same support level twice and then rises. Triangle patterns — symmetrical, ascending, and descending — represent consolidation before a breakout. The symmetrical triangle suggests indecision, the ascending triangle is typically bullish, and the descending triangle is typically bearish. Flags and pennants are continuation patterns that appear after a strong price move, suggesting that the price is gathering momentum before continuing in the same direction. Learning to identify these patterns takes practice, but once you master them, they become one of your most valuable analysis tools.
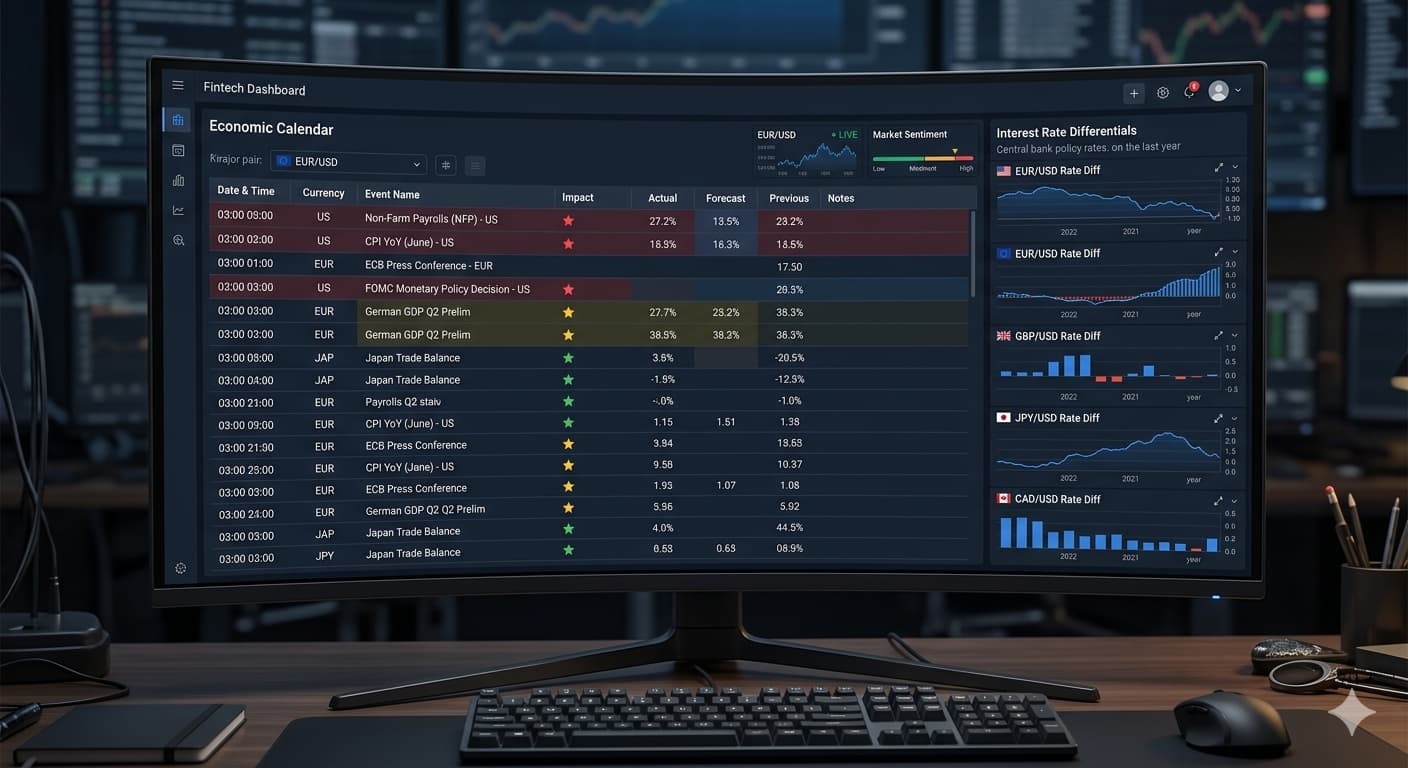
While technical analysis focuses on price and volume data, fundamental analysis examines the economic factors that drive those prices. In forex trading, fundamental analysis is particularly important because currency values are directly influenced by central bank policies, interest rates, inflation data, employment reports, and geopolitical events. For stock traders, fundamentals include earnings reports, revenue growth, debt levels, and industry trends. For commodity traders, it might be supply and demand data, weather patterns, or production reports. As a beginner, you don't need to become an economist, but you should understand the basic economic indicators that move your market. In forex, the most impactful events are central bank interest rate decisions, non-farm payrolls, GDP releases, and inflation reports. These events can cause extreme volatility, and being aware of them before you trade is essential. Many prop firms, including FFT, have specific rules about trading through high-impact news events, so knowing the economic calendar is not just good analysis — it's compliance.
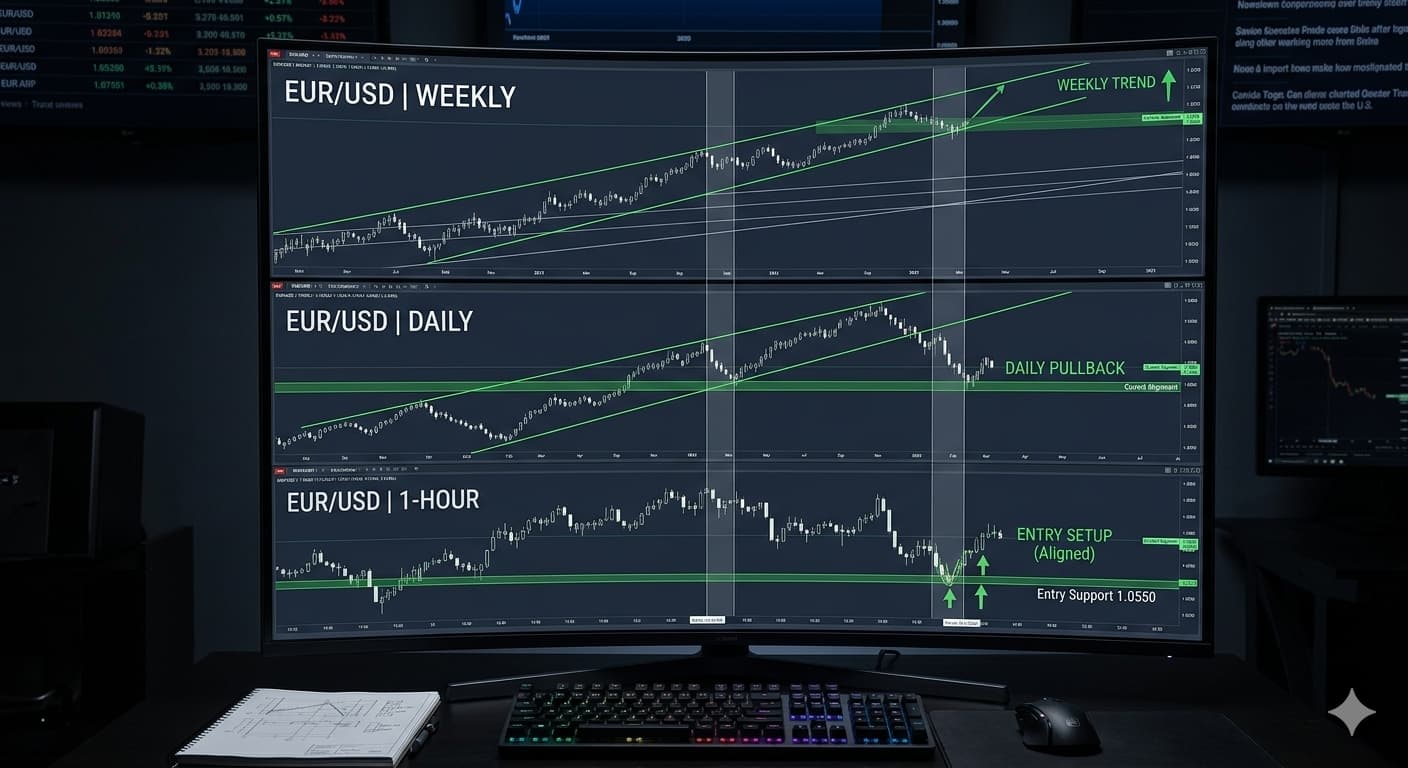
One of the most important concepts in market analysis is the relationship between multiple timeframes. Beginners often make the mistake of analyzing only one timeframe, usually the one they're actively trading on. But the market is fractal — the same patterns and trends that appear on a 1-minute chart also appear on daily and weekly charts. The key is to use higher timeframes to determine the overall trend and lower timeframes to find precise entry points. This is called the top-down analysis approach. Start with the weekly chart to understand the long-term trend. Then look at the daily chart for the intermediate trend. Finally, use the 4-hour or 1-hour chart for entry timing. Trading in the direction of the higher timeframe trend significantly increases your probability of success. If the weekly chart is in a clear uptrend, you should only be looking for long entries on lower timeframes, even if the 1-hour chart looks bearish. Counter-trend trading is possible, but it requires more experience and tighter risk management. For beginners, aligning with the higher timeframe trend is the safest and most profitable approach.
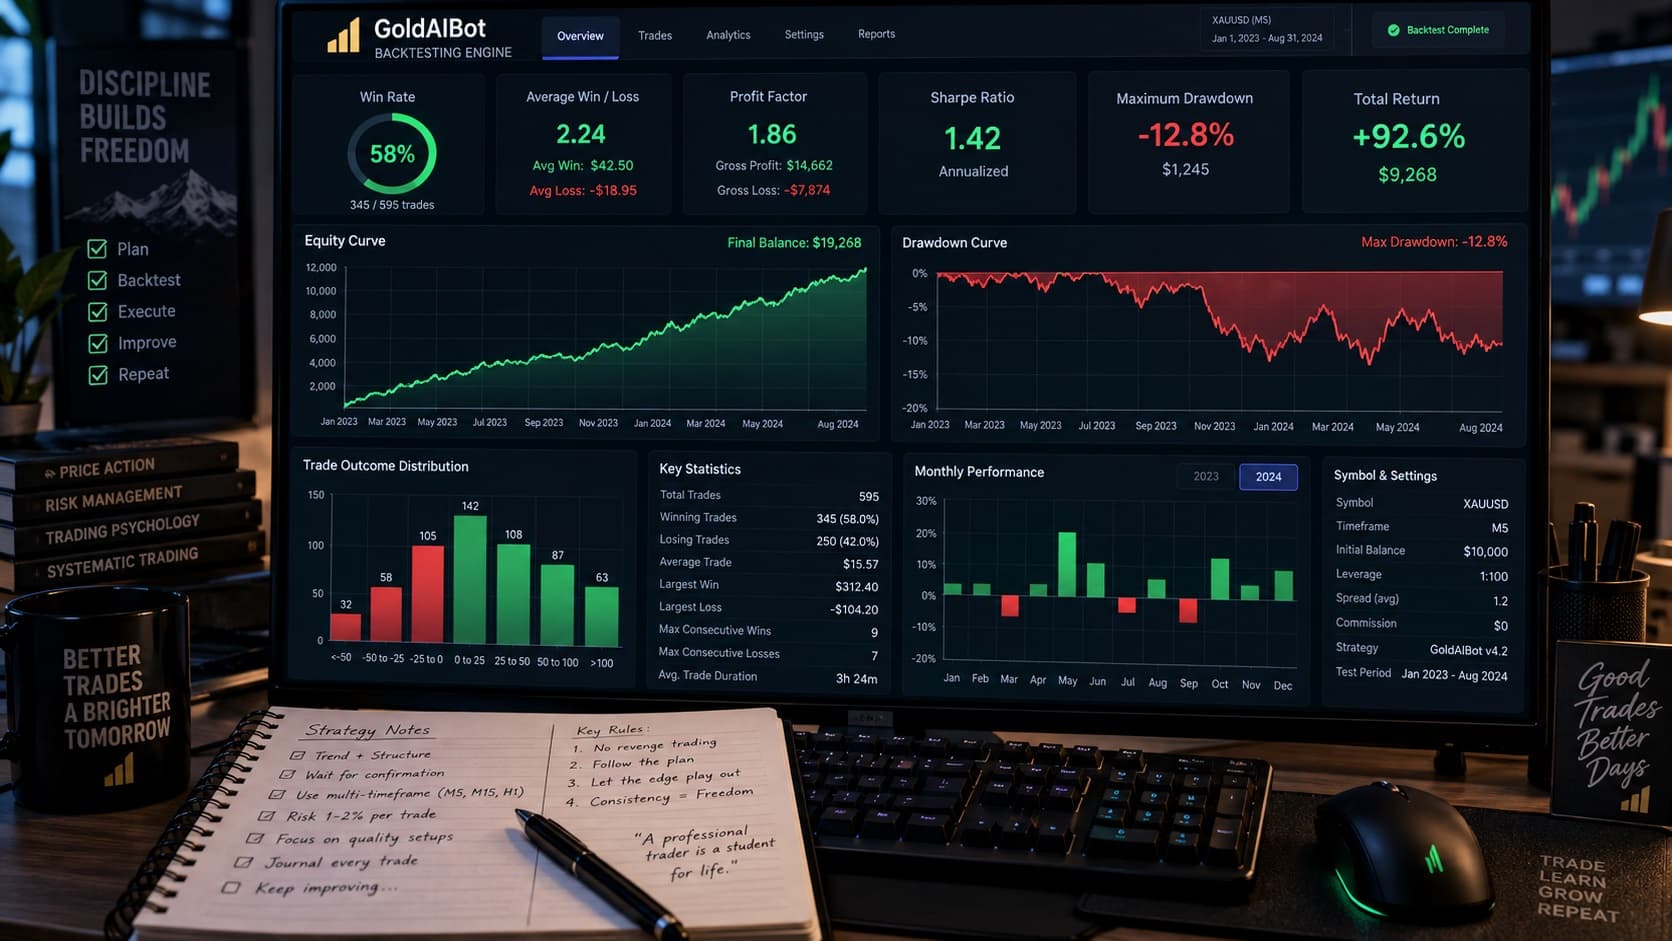
Backtesting is the process of testing your analysis technique and trading strategy on historical data to see how it would have performed. This is one of the most valuable exercises a beginner can do because it builds confidence in your method and reveals weaknesses before you risk real money. To backtest effectively, choose a specific strategy and apply it to at least 100 historical trades. Record the win rate, average win, average loss, and maximum drawdown. If your strategy shows a positive expectancy — meaning the average win multiplied by the win rate is greater than the average loss multiplied by the loss rate — then you have a potentially viable approach. However, backtesting has limitations. It can create a false sense of security because you know what happened in the past. To complement backtesting, use forward testing on a demo account. Forward testing means applying your strategy to live market conditions in real time without risking real money. This reveals whether your strategy holds up in the current market environment. At FFT, we've seen traders skip this step and jump straight into evaluations, only to discover that their strategy doesn't work in live markets. Don't let that be you. Test thoroughly before you commit to an evaluation.
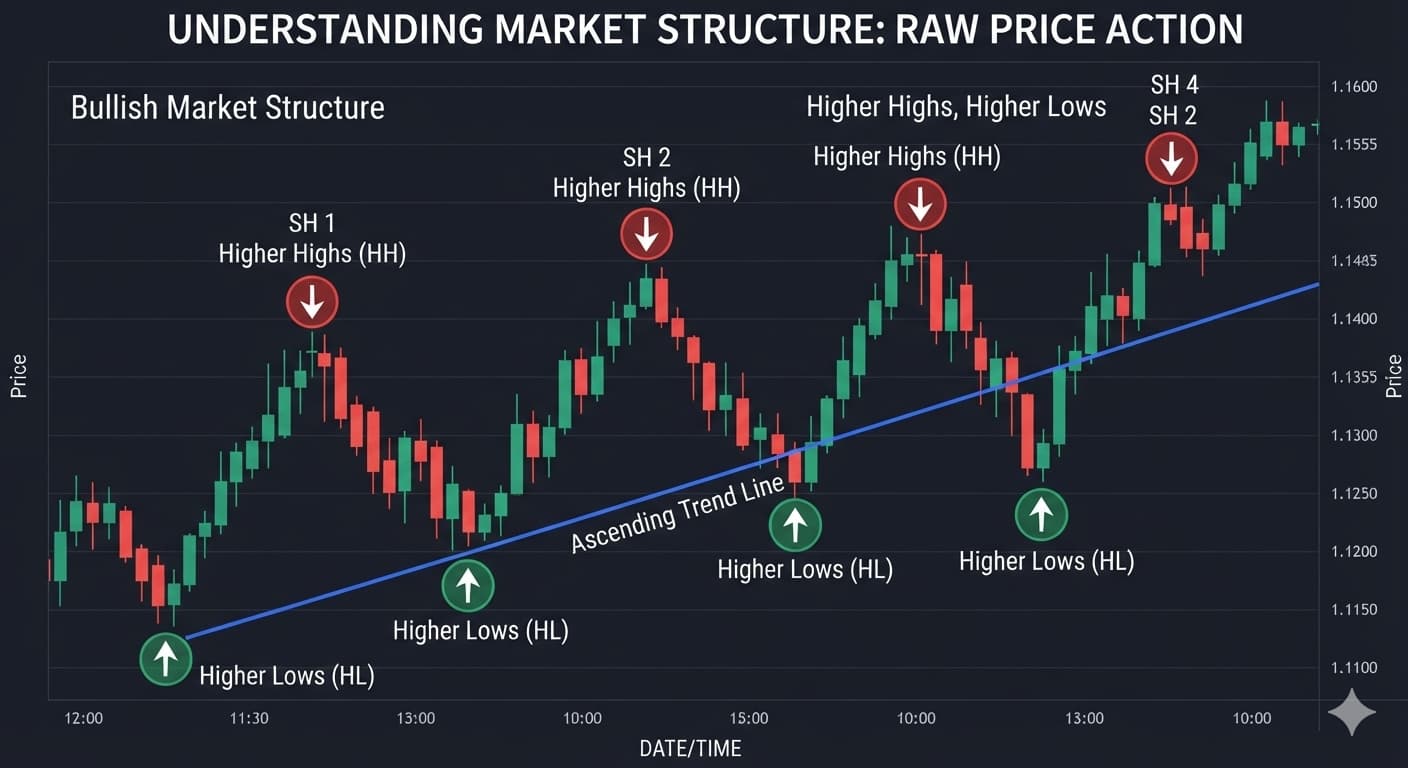
Price action trading is arguably the purest form of market analysis. Instead of relying on lagging indicators, price action traders read the raw price movement on the chart. The core belief is that price reflects everything — all economic data, market sentiment, and trader behavior is already priced into the chart. Price action traders focus on three main elements: trend direction, support and resistance, and candlestick patterns. By combining these elements, they can make high-probability trading decisions without any indicators at all. For beginners, learning price action is an excellent starting point because it teaches you to observe the market directly rather than through a filtered lens of indicators. Start by learning to identify swing highs and swing lows, which are the building blocks of trends. Then practice drawing trend lines and identifying support and resistance zones. Finally, add candlestick patterns to confirm your entries and exits. Price action works on all timeframes and all markets, making it a versatile skill that you can carry with you throughout your trading career.
Indicator-based analysis has its place, but beginners often fall into the trap of indicator overload. It's common to see new traders clutter their charts with RSI, MACD, Bollinger Bands, stochastic oscillators, moving averages, and half a dozen other indicators, all competing for attention. The result is analysis paralysis — they can't make a decision because the indicators are giving conflicting signals. The solution is simplicity. Choose one or two indicators that complement your trading style and master them. If you're a trend follower, a moving average and MACD might be all you need. If you're a swing trader, RSI and Bollinger Bands can help you identify overbought and oversold conditions. Remember that all indicators are derived from price and volume data, which means they are lagging. The price chart always comes first. Use indicators to confirm what the price is already telling you, not to predict what the price will do next. At FFT, we evaluate thousands of traders, and the ones who succeed are usually the ones with the simplest, cleanest charts. Complexity does not equal accuracy.
Understanding market structure is essential for advanced market analysis. Market structure refers to the sequence of swing highs and swing lows that form the skeleton of price movement. A healthy uptrend creates a series of higher highs and higher lows. A healthy downtrend creates lower highs and lower lows. When this structure breaks — for example, when a higher high fails to form in an uptrend — it signals a potential trend change. Market structure also includes concepts like break of structure (BOS) and change of character (CHOCH), which are used by institutional traders to identify high-probability trade setups. BOS occurs when price breaks a significant swing point in the direction of the trend, confirming continuation. CHOCH occurs when price breaks a significant swing point against the trend direction, signaling a potential reversal. As a beginner, start by simply identifying the sequence of swing points on your chart. Are they making higher highs and higher lows? Are they making lower highs and lower lows? This simple observation will keep you on the right side of the market more often than any indicator.
A common mistake among beginners is confusing analysis with prediction. Analysis is about understanding what the market is currently doing and what it has done in the past. Prediction is about guessing what the market will do in the future. No one can predict the future with certainty, not even the most experienced traders. The goal of analysis is not to be right all the time — it's to identify setups where the probability of success is higher than the probability of failure, and where the potential reward justifies the risk. When you approach analysis with this mindset, you stop looking for the 'perfect' entry and start looking for high-probability setups that align with your risk management rules. This shift in perspective is one of the most important milestones in a trader's development. At FFT, we see this distinction clearly in our evaluation data. Traders who treat analysis as a tool for risk management consistently outperform those who treat it as a crystal ball.

Building a daily analysis routine is the final piece of the puzzle. Successful traders don't just wake up and start trading. They have a structured routine that prepares them for the trading session. A basic routine might include: checking the economic calendar for high-impact news events, reviewing the higher timeframe charts (weekly and daily) for trend direction and key levels, identifying the day's key support and resistance zones, scanning for potential setups on the trading timeframe, and defining your risk parameters for the day. This routine takes 15-20 minutes but saves hours of poor decision-making later. At FFT, we've found that traders who follow a consistent pre-market routine have significantly higher evaluation pass rates. The routine doesn't need to be complex — it just needs to be consistent. Start building yours today, even if you're still on a demo account. The habits you form now will carry you through your entire trading career.

At FFT, we support traders who use any analysis method that works. Whether you're a pure technical analyst, a fundamental trader, or a blend of both, what matters most is consistency and discipline. The techniques covered in this guide — support and resistance, trend lines, moving averages, volume analysis, candlestick patterns, chart patterns, fundamental awareness, multiple timeframe analysis, and price action — are the building blocks of professional market analysis. You don't need to master all of them at once. Pick two or three that resonate with your trading style, practice them until they become second nature, and then add more. The best analysis is the analysis you can execute consistently under pressure. Start with the basics, stay patient, and remember that every professional trader was once a beginner learning these exact same concepts. Your journey to becoming a funded trader starts with understanding the market.